Investigating CPU spikes for ASP.NET on Windows
 by Alex Yumashev ·
Updated Oct 29 2020
by Alex Yumashev ·
Updated Oct 29 2020
Ever found yourself looking at the w3wp.exe process eating 80% CPU and wondering "what the heck is ASP.NET (Core) doing"?
Googling for solutions usually brings up suggestions to get one of those CPU profilers like ANTS or JetBrains (or involves weird Voodoo magic with WinDbg).
There's a simpler way
Enter PerfView
PerfView is a free and open source profiler from Microsoft. It's fast, portable (as in "does not require any installation") and adds zero overhead, so it's safe to use in a production system.
We were previously using a command line tool called "cpu-profiler" and I blogged about the details here. And while the tool has served us well for many years, it has one huge drawback: to investigate the expensive threads and call stacks it attaches to a process as a "debugger". Which slows things down even more.
While PerfView uses Windows' built-in ETW ("event tracing") engine that is very efficient, adds little to no overhead, causing zero (0) extra CPU load for an already overwhelmed server.
Collecting data is really simple:
- Start PerfView, select "Collect - Collect" in the menu
- Click "Start collection"
And that's it. The tool will start taking snapshots until you click "Stop". After that wait until PerfView finishes generating the report and do this:
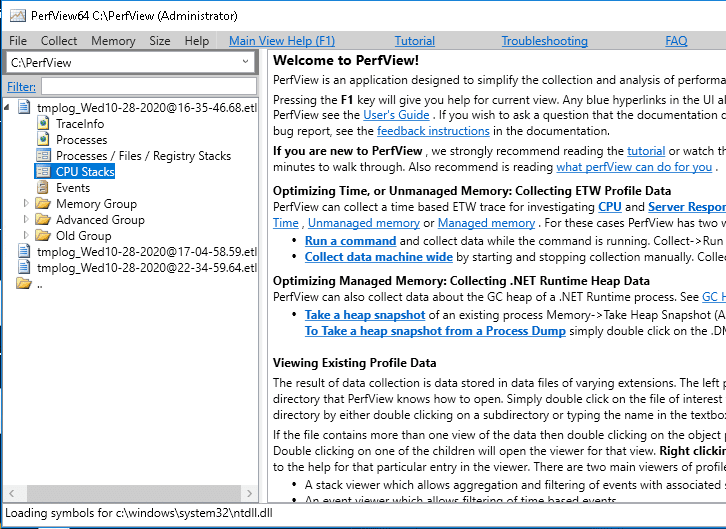
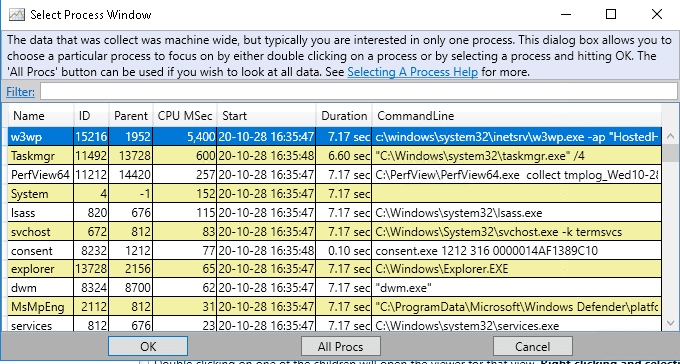
- Select "CPU Stacks"
- Select w3wp in the list of processes
You'll see the methods where your code spent most of its time.
Monitoring CPU spikes automatically
There are a lot of PerfView tutorials and even videos on how to use PerfView, but you're often not that lucky to be RDP'ed to a server the exact moment when the CPU goes up, are you? So we're interested in scripting PerfView the way that it starts gathering data automatically, when the server starts overheating.
Step 1: create this bat file
@echo off

SET /A "MAXUSAGE=70"

set SAVESTAMP=%DATE:/=-%@%TIME::=-%
set SAVESTAMP=%SAVESTAMP: =%
set SAVESTAMP=%SAVESTAMP:,=.%

For /F %%P in ('wmic cpu get loadpercentage ^| FINDSTR "[0-9]"') do (
    echo %%P
    IF %%P GTR %MAXUSAGE% (
        C:\PerfView\PerfView64.exe collect tmplog_%SAVESTAMP%.etl /logFile:tmplog_%SAVESTAMP%.log /AcceptEula /MaxCollectSec:4 /LowPriority /ZIP:false
    )
)
Let's go through the script step by step: first it sets a 70% threshold, that should trigger the logging.
Next it simply puts the current date & time into the SAVESTAMP variable (to be used in log filenames later).
Then it checks if the CPU load is actually higher than 70%, and if it is - it launches PerfView (in the CLI-only mode) and runs it for 4 seconds.
Once the script finishes, you'll have an .etl file in the working directory, that you'll be able to open with PerfView itself (launched in GUI mode) and investigate the call stacks.
Step 2: create a Task Scheduler task
Now simply create a Task Scheduler task that runs every 5 minutes and launches this BAT file "as administrator" (i.e. check the "run with highest privileges" box).
(yes, sure, there are more sophisitcated ways to trigger tracing, like create a "performance counter" event with a trigger that will launch tracing once CPU load passes some threshold, etc. but hey let's keep things simple)
Step 3 - investigate
Now visit the server, launch PerfView and open the log files directory you specified in the .bat file (using the left sidebar). Open up an .etl log, and go to "CPU stacks", double click the "w3wp" process and - voila - you'll get the list of your most expensive methods inside the app.
P.S. remember to clean %TEMP%/PerfView directory every other day, the temp logs may pile up quickly.