Lessons learned from analyzing 7 million customer support tickets
 by Max Al Farakh ·
Updated Apr 4 2019
by Max Al Farakh ·
Updated Apr 4 2019
Next month we are going to hit a total of seven million tickets handled by the Jitbit Helpdesk customers. Jitbit has been around for almost ten years, and we've accumulated a lot of data. So we thought we dig in and see what we can find.
The data
We've analyzed almost seven million tickets handled by hundreds of different companies. The absolute majority of the analyzed support tickets come from western people with about 70% to 30% split between North America and Europe respectively. Our customers come from a variety of different industries ranging from tech startups to health care and education.
The sample size is large enough and the data is not skewed. While we have some outliers, it's nothing major. Most of our customer handle pretty much the same amount of tickets per month. So it's not like 80% of the presented data comes from 20% of the customers.
I should note that all the data was anonymous and we've only looked at the tickets metadata - mostly just the ticket creation date.
Distribution of tickets per hour
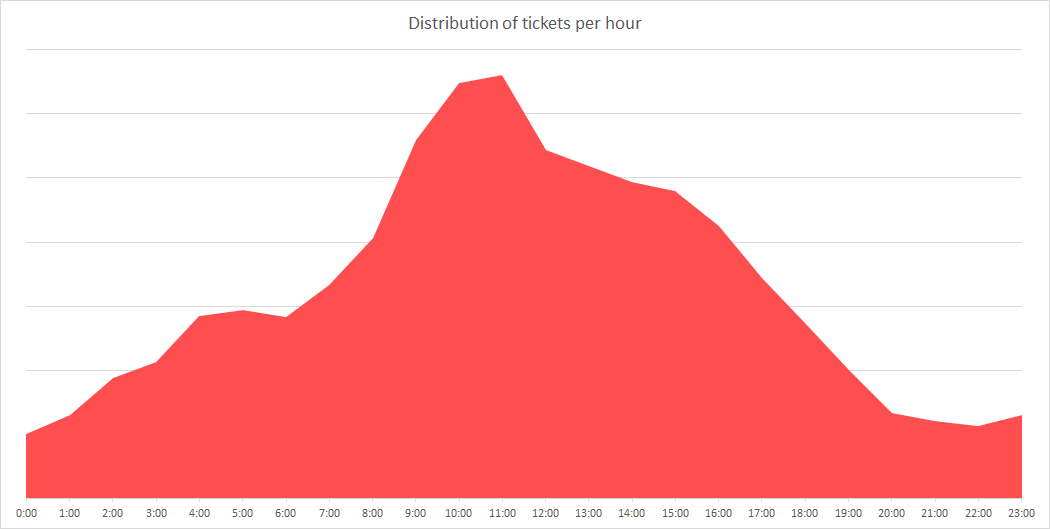
We've analyzed the data for each company in their local time zones and put it all together. So all the times are local to the businesses that handled the tickets.
You can clearly see that there is a huge spike between 9 AM and 12 PM -- this is the busiest time for every help desk we analyzed with no exceptions. Basically from the start of the work day until the lunch break is when people are the most active.
The data on the graph pretty much correlates with the standard working hours which is expected. Also, there are a lot of tickets created in the middle of the night -- this is because a lot of companies (including Jitbit) work with customers all around the world.
Distribution of tickets per day of the week
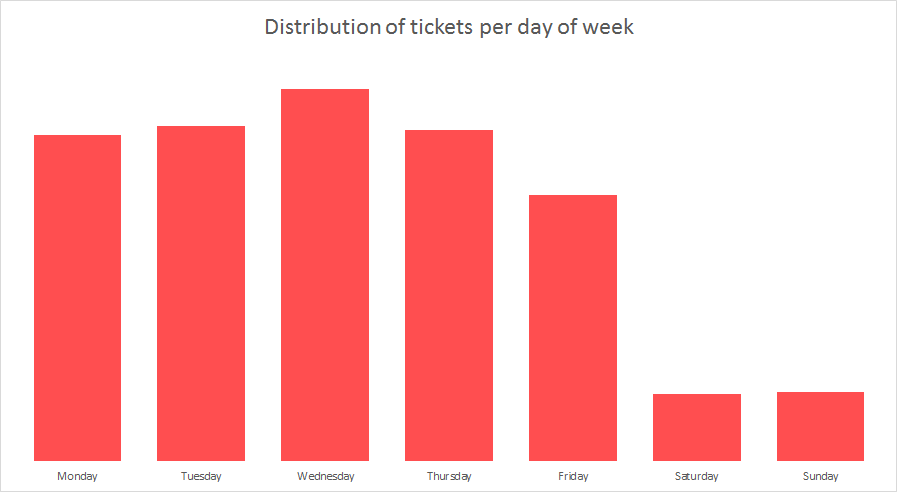
The busiest day of the week is Wednesday followed closely by Tuesday and Thursday. Monday, to my surprise, is relatively relaxed. Lastly, there is a significant drop in activity on Friday.
Fun fact: unlike customers, support teams work a lot on Mondays. Most likely, everyone is catching up with the tickets that were left over from the last week.
Distribution of support tickets per month
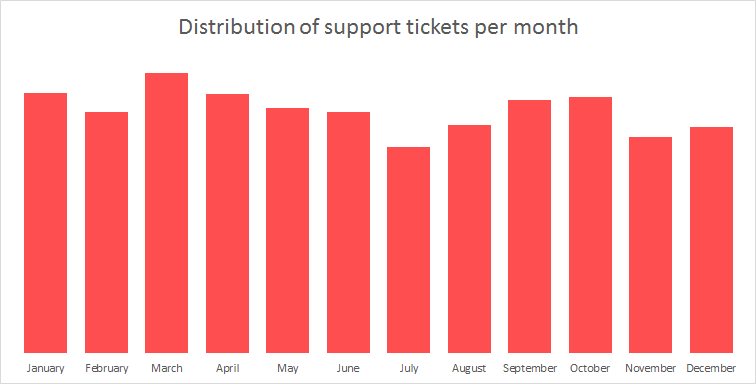
Overall activity drops off two times per year - in the summer and the beginning of winter.
Summer is a traditional vacation period for most people you can see a significant drop in July. The middle of the summer is by far the least busy time of the year.
The second drop starts with Thanksgiving and lasts until New Year. After the holidays the activity goes up to the normal levels in January.
The busiest periods of the year are the spring and the beginning of the fall. For some reason, March has a clear 10% lead above every other month.
Average response time
The response time is the time between the ticket creation date and the first response from a support technician. Here is the biggest surprise from our research. The average response time across hundreds of companies and millions of support tickets is 5.32 hours.
I would've been happy with anything less than 24 hours. Five hours is just incredible. In disbelief, I decided to dig a bit deeper. I found that the response times have dropped significantly during the last two years. We really stepped up our customer support game. Congrats, everyone!
Average resolution time
The last metric we are going to look into is resolution time - the time between the ticket submission and closure. I think this metric is very specific to each industry, but I've included it for good measure. The average resolution time is 7.33 days. Which seems like a lot, but again this is very specific to the industry. Some companies may have tickets that take months to resolve, while others have tickets that can be resolved in minutes. Overall, I don't think resolution time is a good indication of your performance.
Conclusion
This is what we could find from seven million customer support tickets. Hopefully, it will help you in some way. At least now you know that Wednesdays in March are pretty much the worst days ever. But being prepared is already half the battle, right?
If you have any ideas on some other stats and metrics, we can analyze, just let us know in the comments.