27 Experts Discuss Key Customer Support Metrics That Drive Growth
 by Robbie Richards ·
Updated Aug 7 2020
by Robbie Richards ·
Updated Aug 7 2020
It’s the greatest truth of our age: “Information is not knowledge,” says author Caleb Carr.
It’s a sentiment befitting today’s digital era, where data is inherently collected and made readily available at any given moment. But when it comes to measuring and using that data effectively, many companies are at a loss as to why certain metrics matter, and what purpose they serve.
Truth is:
Metrics are completely useless if you don’t know how to interpret them, or why you have them. This is especially true in the dog-eat-dog world of customer support where seconds can mean the difference between crippling churn, and high lifetime value.
Despite the importance of having a clearly defined set of KPIs, companies often find themselves monitoring things that are measurable, but not necessarily meaningful.
The customer support channel can be measured, analyzed and critiqued a million and one different ways. Call volume, chat times, response rates, close ratios, and a laundry list of other metrics are easier to record and analyze than ever before, across multiple layers of an organization - agent and team levels.
And, therein lies the problem. So many options often leave you feeling lost:

While a helpdesk solution can give you all the data points, it will not tell which metrics are most important to your business.
So, with all that said, the burning question remains:
What should you be measuring, and how should be reporting on it at an individual agent and team level?
Rather than compile another massive list of support metrics (been done a million times already) that leaves you scratching your head not knowing where to start, we decided to go to straight to the horse's mouth.
We reached out to 27 professionals leading support teams of all sizes at companies like Zapier, and asked them the following question:
Can you list 2-3 customer support metrics you use to measure performance in the following areas:
1. Individual agent metrics
2. Team level metrics
The goal was to identify companies with successful support teams and see what metrics they used to assess performance and continually improve the customer experience.
Let’s dive in:

Craig Nagovan
I used to work for a company with ~7,000 employees in my building, 53,000 worldwide, and the amount of over emphasis placed on reporting rather than DOING was staggering. I think that was a function of, "I need to justify my team's existence/performance to my boss, who needs to justify it to her boss," and repeat that thought process to a ludicrous degree. I like to think that I learned something from that experience and applied it to my own reporting style for the Close.io support team.)
Anyway, I hope this helps:
Individual metrics are a waste of time. If you call yourselves a team, act like it.
Because ticket times vary widely, we don't measure the number of tickets each person responds to. It’s easy to cherry-pick the quick ones, so caring about that number only encourages bad behavior. We care about answering ALL tickets as promptly and thoroughly as possible, as a team.
Too many factors affect the time it takes to resolve a ticket. You can certainly take the averages over a period of time (and we did that), but this number is unlikely to influence behavior. We didn’t find ourselves operating any faster or slower based on this information, so we stopped tracking it.
Team metrics we do care about:
Ticket type. We decided on a handful of labels for tickets to help identify what specifically is causing headaches. This is great for the engineers and product team to address concerns for future updates.
Customer stories. Specific use cases are infinitely more interesting than abstract suggestions or problems. A real customer being impacted in a real way carries more weight for the team, and weekly reminders that there are humans on the other end of these emails provide a lot of motivation.
New projects. We are not ticket-answering robots. We look for ways to improve internal processes, refine documentation, and add value outside of the ticket queue. The team likes to hear about innovations on this front, and we like to break up the monotony and get creative.

Micah Bennett
At the individual level, the metric we focus on most heavily is reply count, as it's a singular unit of effort. We also use individual ticket review and keep an eye on replies per ticket to make sure that we aren't incentivizing quantity at the expense of quality.
At the team level, we work on maximizing the percentage of replies sent within an hour that they were received. We've found that within an hour, users are still working on the task at hand and are therefore extra satisfied when we get back to them in that timeframe. Beyond an hour, it matters a bit less how fast we are since they've often moved on to something else.
By using 1 hour as a threshold instead of something like 15 minutes, that lets us maximize user happiness by giving them replies when they are still engaged with that task without forcing our team to sacrifice quality to rush to meet that threshold.

Yoni Dariel
Working closely with team leaders in global B2B brands taught us a thing or two about the metrics top performing leaders seek. It usually comes down to response time and touchpoint and velocity. These two metrics are pretty straightforward if you think about it. So simple and powerful yet so hard to achieve and govern, especially at scale.
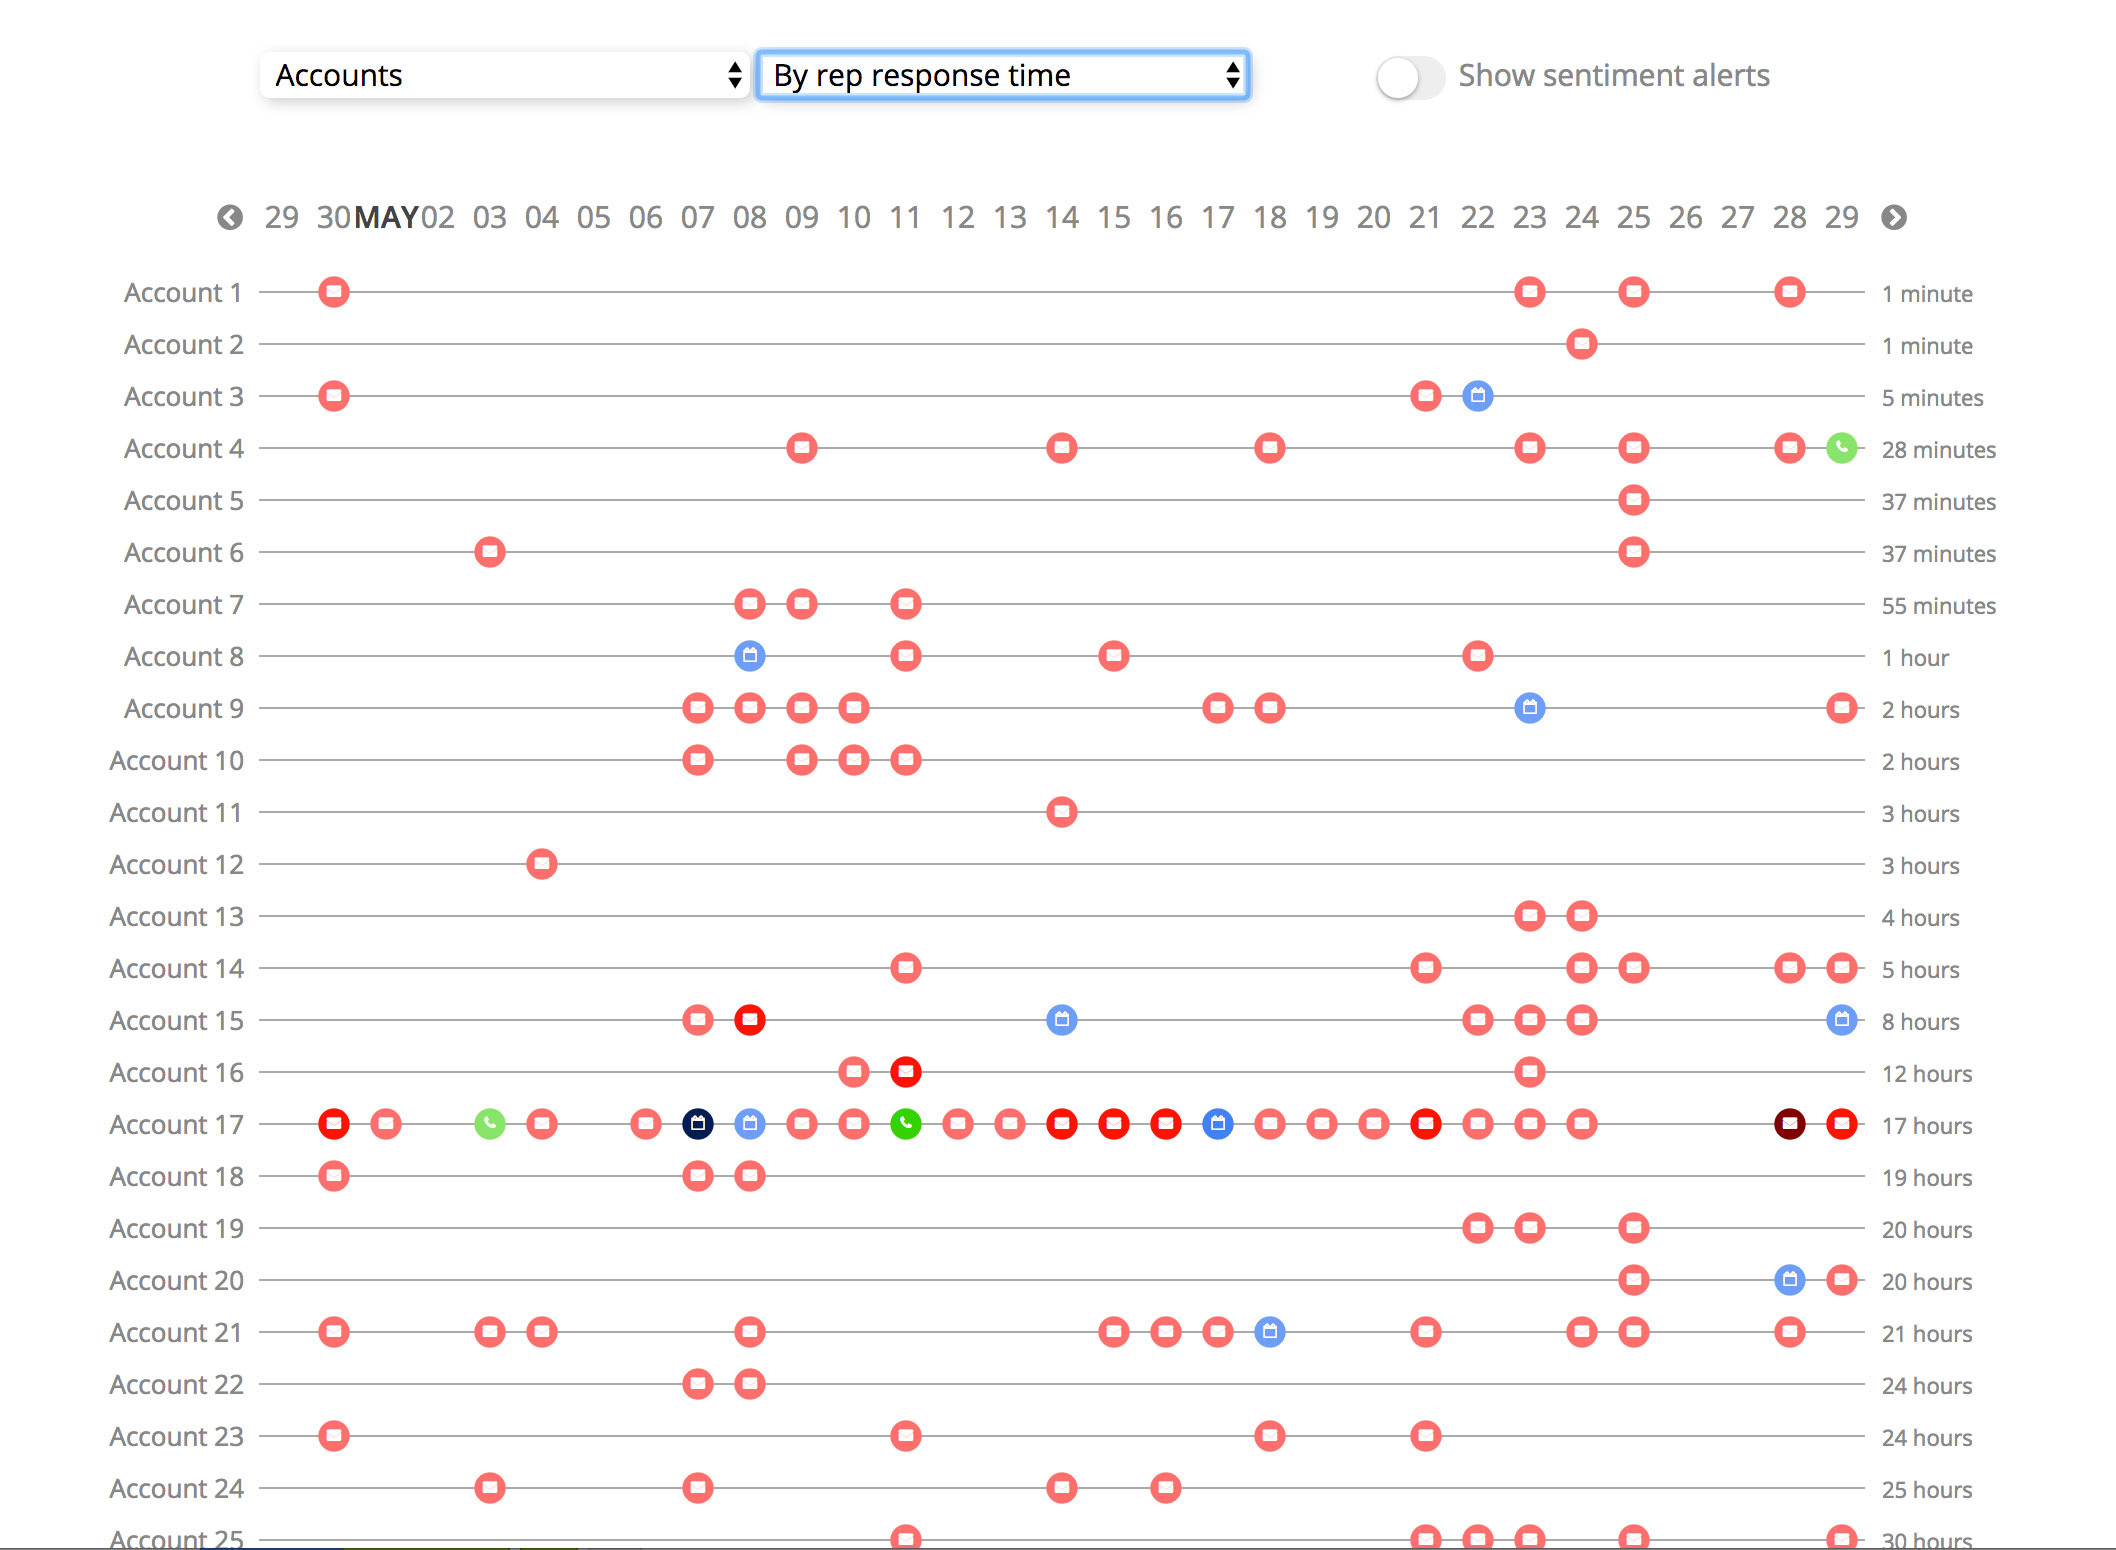
Response time usually reflects the time it takes a rep to respond to a customer's request, whether a product related question, a support ticket, or even just an ordinary outreach. Any customer-facing activity is in its essence relationship building. The time it takes the rep to get back to the customer says a lot about the rep, the team, and the company.
On the rep level, executing on this metric with high-performance usually correlates with top-performance by the rep on all other major KPIs. On a team level, it can provide a good indication of the team leader's attention to details. Succeeding or failing to govern this metric on the company level says a lot about the processes in place and leadership in general. Below is an example response time visual report:
Touchpoint and velocity are a far less straightforward metrics, let alone simple. their purpose is to "draw the golden path" to the perfect interaction pattern. Or in other words, these metrics make the recipe for building the right relationships with the company's customers: when, how and how much you need to interact with your customers to successfully achieve what needs achieving.
Touchpoints traditionally refer to the stage and the mean of communication used to interact with the customer or the prospect. For example, 1st or 2nd interaction, done via email, a meeting, a demo, or a phone call. The velocity tends to refer to the gaps between interactions and the general number of touchpoints used with a customer or prospect to achieve a certain goal.
Relentlessly measuring and iterating on these metrics will eventually allow companies to capture their "repeatable-success-patterns" which can lead to exponential growth.

Vinay Patankar
We track two key metrics in support.
1. Median response time. We track this metric mostly because it's the default one provided by our support app Intercom lol. Their reporting capabilities are a little limited so we just focus on keeping a low response time (currently targeted at under 180 minutes) and use that to drive the teams behavior.
2. NPS. Net Promoter Score is how we track support quality. While this metric also tracks a few other things, low quality support can cause a low NPS response, and when we get a response and it mentions support in the "why did you chose this number" question we use that as an indicator to investigate the support process.

Stephen Panico
For individual agents, we like to focus on lead metrics (metrics that they have direct control over). In our case, we’ve found that the time to first response and time to full resolution correlate most strongly with customer happiness and retention.
We also measure account triage at the agent level so we have an understanding of which accounts are doing well and which could use some proactive help. We measure lag metrics at the team level, focusing on maintaining a customer satisfaction rating of 99% or higher for direct engagements, percentage of engaged customers, ratio of accounts that are known to be happy, and retention at various stages of the customer lifecycle.
This approach allows us to give agents much more autonomy relating to the metrics they are evaluated on, while still ensuring that those lead metrics are having a strong impact on our overall goals.
In a team like ours, this is extremely important because we give everyone direct ownership over their primary responsibilities. It also allows us to experiment with different approaches to achieving those direct and team goals.
For example, one of the big initiatives that arose as a result of this focus was the redesign of BuzzStream University. This allowed our success team to rapidly decrease the turnaround on basic account and product usage questions, which in turn drove our full resolution time way down. The other great thing about this approach is the amount of focus it provides.
We’re a very lean time by choice, so people are constantly getting pulled in a lot of different directions. By having only a few focused metrics that must be met each week, we can make sure we are addressing the most important things while still allowing flexibility to get involved in other areas of the business.

Anthony Hagood
I would start by stating that we look at a number of different items and set goals down from the company level, department level and then to do the individual level. While I might look at a number of metrics I only have a few goals assigned to the front line team. This is done so they can concentrate on the most important task at hand.
When I look at the additional metrics, I do it for the purpose of observing if anyone is out of scope of their peers. As I enable my team to accomplish their goals the way they see best, I have found that at times someone is handling certain task better than others and that is why they are out of scope. During our weekly team meeting we try and get those ideas shared with everyone to help the team.
As we are an Financial Consolidation, Reporting and Benchmarking SaaS software and offer on-boarding services to our customer’s end client making the connection with the end client has taken longer than a normal SaaS company as we have to take focus off their day to day task for 30 minutes and help introduce our solution into their accounting business flow. This is where we spend the bulk of our time currently.
Monthly Measures
Individual goals
- Call all assigned on-boarding customers once a week and document in Salesforce (emails are automated)
- Available in phone and chat 6 hours a day
Other Individual Metrics I look at:
- Customer Satisfaction
- Time to first reply
- Total chats and tickets
Team goals
- On-board 20% of available inventory
- 95% customer satisfaction rate (Currently 100% since I have been here)
- Time to first response under 30 seconds (75% of inquiries come in from chat)

Jeremy Majchrzak
Some of the metrics we at Glance Networks feel are critical include:
- Customer adoption
- Customer retention
- Account activity summary
- Average handle time
- First call resolution
- Customer effort score
Customer adoption, customer retention, and account activity summary are important because we really want to understand what makes our customers tick. Who is using our solutions the most and what inspires them to do so? What can we do differently if a customer is considering going someplace else? These are critical metrics for us to use to understand and improve the customer journey.
Customer effort score, average handle time, and first call resolution are important for a different reason. Reducing customer effort leads to a shorter time to resolution and a greater rate of first call resolution.
One of Glance Networks’ core beliefs is that the length of a call is significantly less important than making sure customers get what they need with minimal effort. To make that happen, we use our own visual engagement solutions based on a platform that integrates cobrowse, screen share, and one-way agent video.
Visual engagement solutions allow our employees to see what our customers see, even if we’re separated by a great distance. When we can see where customers are, we can instantly diagnose any issues and help solve them.
Making it easy for customers to get answers to their questions increases their satisfaction. In addition, resolving issues the first time customers call increases customer loyalty. Why is this important? It all circles back to customer retention. Creating an atmosphere of positive customer experiences results in great long-term gains like happier customers, deeper customer loyalty, and positive online reviews.

Katie Propati
All of our metrics are tracked at a team level. We are an all hands on deck kind of team. While we individually manage clients, the work that goes into actually managing clients spans all of our teams.
Recently, we've been focused on time to launch (from implementation kick off to system first launch) and metrics around tickets (number, type, time to solution, etc). These have been particularly useful as we've revamped our implementation process and started to develop and update our support resources and tools.
We've based our support strategies by monitoring and evaluating where our customers hit snags and introducing the appropriate solutions to eliminate those speed bumps.

Jeremy Watkin
I liken managing agent and team metrics on a support team to a high wire balancing act. On one hand, you need to have a productivity metric to ensure that time is being used wisely.
For example, if this is an email team, you might track responses per hour or broaden that to all touches to get a full scope of their activity. On an individual level, the productivity metric should always be balanced with a quality metric which is a combination of either internal quality assurance or first contact resolution and external customer satisfaction.
I caution support leaders to be careful of too quickly drawing a line in the sand on any one individual metric. For example, constantly throttling up productivity could spell serious problems for quality and first contact resolution.
Looking at this from the team level, put them in a position where they are working together to drive up customer satisfaction. This means creating an environment where the team is constantly doing what’s within their power to improve it and they’re sharing what’s outside of their control with the rest of the organization.
Ultimately, if we collectively improve the customer experience, we all win, right?

Venus Kaur
Support Team of any SaaS company get their users to stick around as paying customers. We are proud of the service that we provide to our customers and this is evident from the feedback that keeps flowing in from them:
“The support rep has been really responsive and was able to resolve the issue raised in a very timely manner. I am so happy with the VWO support that it just makes our lives easier.”
“Speedy response. Simplified solution. Happy customer. Thank you.”
“Just very, very quick and efficient!”
“Any time that I contact VWO support they are always so fast and extremely helpful. It's so hard to find that, so I really wanted to stress how helpful it is for me as a user.”
Individual and Team Metrics are important for measuring the current performance and take informed decisions for future improvements so that we can keep on excelling.
Here at VWO, our Support Team ensures that we send timely responses to our customers without sacrificing on the quality. Customer happiness is of prime importance for all of us and all our efforts are focused in the same direction.
The most important individual level metric that we primarily focus on is Response Time.
As per the historic data, our average first response time is approximately 30 minutes. We also ensure that we don’t compromise on the quality of the responses and we are able to provide a resolution for the client in the first response itself or at least as soon as possible.
Speedy and Adequate responses are the key to our happy customers. This is a fact that we absolutely love to rave about!!!
In addition to Response Time, the important team level metric that we primarily focus on is CSAT (Customer Satisfaction).
We maintain a healthy CSAT (95% on an average) and follow-up with customers for detailed feedback. We take feedback seriously and continuously try to improve our services and the product based on it.
Other than this, we ensure that we meet all the SLAs, round the clock. This is very critical from a team level perspective and we make sure that there are no misses from our end.
To use the words of Jeff Bezos, CEO of the World’s leading brand in terms of Customer Success Amazon:
We see our customers as invited guests to a party, and we are the hosts. It’s our job every day to make every important aspect of the customer experience a little bit better. – Jeff Bezos, CEO Amazon
This is what we truly believe in, here at VWO - We not only meet our customer expectations, but try exceeding them.

Mark Somol
We are focused on overall customer health metrics.
Our #1 metric is NPS. We track customer referencability (is a customer willing to take a reference call, which is important for B2B sales). Team-based metrics include: avg time to 1st reply, avg. time to resolution, new tickets and resolved tickets.
We have a strong bias to team metrics because I would rather have a high performer have some incentive to teach others and raise the skill level of the entire team.

Yoav Shalev
1. On the individual level we measure the clients satisfaction with the response they got. This means we are looking to see if the the agent was able to answer the client's need in an adequate and timely manner. We also look at metrics such as upgrade conversions and user retention.
2. On the team level we measure the overall answer rate, client satisfaction and the team's effectiveness in providing support that can be translated into customer success (on boarding steps completed, platform usability, etc)

David Hoos
The customer retention rate is one of the most important customer support metrics and should be your top priority. If you're not retaining a high percentage of the clients that you tried so hard to acquire, you're wasting money.
Next, the client up-sell rate would be the next most important. Getting your clients to take the next step, upgrade, or better tailor their service level to their needs, is essential to growth. In some instances, you can make up the difference from your client cancellations by up-selling those who stick around.
Finally, at the team level, you can explore the Net Promoter Score (NPS) or a similar type of metric to understand how the team is impacting the customer experience as a whole.

Leeyen Rogers
Individual agent metrics
We look at how many tickets have been answered as well as the quality of the answers. Was the customer's problem solved? Was it solved in the most elegant way? Random support threads are looked into and accessed on a regular basis.
JotForm publishes support queries in our forum (unless a customer chooses to make the interaction private) so that other people who experience the same issue can get their questions answered sooner, as they can search the forum to find previously asked questions. So, it is easy to take a qualitative look at the experience our customers have with our support team.
Team level metrics
Here at JotForm, we look at how the team is able to juggle customer support inquiries. The JotForm support team scales up when we are releasing new products and features, and relaxes a bit when things are swimming along. We're always seeking to strike the right balance so that our users can have prompt and effective support.

Sam Hurley
Through experience working in eCommerce and also collaborating with B2C clients, these are some important metrics to track for maximum efficiency and performance:
Individual metrics:
- Individual Customer Service Rating
How your agent is perceived by the customers to which they are assigned.
How? (Best conducted via a mixture of closed and open questions.)
- Average Resolution Time
How? Total time taken to resolve requests / Total number of resolved requests. (Also useful for global team metrics.)
- Resolution Rate
- Customer Satisfaction Score (CSAT)
- Net Promoter Score (NPS)
Out of every customer support request received by the agent, how many were resolved successfully? (Also useful for global team metrics.)
How? Total resolved requests / Total requests.
Team metrics:
How your brand (and its experience) is perceived by customers.
How? (Best conducted via a mixture of closed and open questions.)
A measure of how likely your customers are to recommend your brand to a friend, family member or colleague.
How? (The above question on a scale of 0 - 10, as a percentage.)

Ajay Goel
Our individual and team-level metrics are the same, because we have a very small support team which consists of me and one other person. These metrics are:
1. The time which elapses from when the support ticket comes in to when the customer first receives a response.
2. The accuracy of the answer. We receive many complex support questions, so it's important for us to provide correct answers.
3. The amount of back-and-forth between the user and our team in solving the issue (which I always try to minimize).
We write a lot of content on our blog in order to address every potential support question we can think of, so we often respond to support questions with links to blog posts in the hope that this will solve these issues.
If more extensive correspondence is required, that generally indicates that the support agent doesn't have a deep understanding of the issue or doesn't know how to retrieve certain information for the user (and has to ask the user for this information), or that the agent simply doesn't know which blog post to link to.

Barb Easter
It's important to consider whether your measurements are a true reflection whether your customers are actually satisfied or not. With that in mind, we aren't afraid to look at our data set and pull out more information or change our yardstick a little bit to make sure we're measuring a true metric of customer satisfaction.
We also ensure that we're looking through both ends of the telescope - its important to measure details accurately, but also to look at the big picture....much like Dryrun itself. :)
Without accurate data, it's difficult to determine what types of metrics are valuable; conversely, without clear goals defining which metrics carry the most impact for your team, you'll get lost in meaningless reports.
What are some meaningful measures of performance for individual agents?
Number of resolved cases: This one's foundational. A lower number of resolved cases per agent often indicates a need for more training on Dryrun or more training for effective support techniques.
Post-contact customer satisfaction: Reaching out and boldly asking for evaluation about our software and their recent interaction with our team takes some courage, but is a great way to solicit feedback and manage any additional questions or concerns that our customers may have.
What are some meaningful measures of performance for teams?
Time to first response: Our customer base is global, so we do our best to manage their expectation of our 'available' hours here in Canada. However, it's a point of pride that we frequently delight our customers from around the world by exceeding our stated availability to tend to their needs. We have a friendly competition going as to who can provide an empathetic first response the quickest since this resonates well with today's customers and is good for the Dryrun team's morale.
Number of necessary interactions per resolution: While we think it's perfectly okay to ask for all the information relating to the problem, then performing some research on our side prior to getting back in touch with a resolution, the number of interactions per resolution is important to consider.
We use Intercom for our main e-channel, whose threaded view and back end messaging between teammates make it easy to stay up to date on the progress of a customer solution instead of having to bounce our customers from department to department. So we don't track the lowest number of interactions per resolution, but the lowest necessary interactions per resolution.
Average handle time: While average handle time is a factor, it's far more important to our team that the interaction be handled positively rather than quickly. We take a broad view of team handling times referenced with our customer satisfaction ratings.

Bradford Swanson
I think it's critically important to prioritize Customer Satisfaction and Time to First Response. Too much pressure on the team to close tickets quickly can have dangerous effects on the customer experience. These can be hard to recover from, especially for a young company. This can be especially true if you're in an early stage of your product development. Outstanding support can help buy some extra patience and goodwill with your early adopters, and net positive reviews out in the field long-term.
Measuring the engagement and satisfaction of the team members is critically important too. This can be hard to get an accurate quantitive read on with a small team, but even just asking them to mark their workload and daily mood on a scale as they clock out at the end of the day, you might get an early indication of burnout or disengagement. If the agents aren't excited about the product, or don't feel like they have a say in product improvements, this can really effect morale, and ends up getting telegraphed to customers.
I think it's also important for managers keep an eye on promotion rates within young teams. How many successful agents have started on the support team and matriculated into bigger roles at your company? Setting agents up for growth opportunities and mentoring is important, and their experience in the trenches with customers can be invaluable at higher levels of your organization.
For individual agents, I think CSAT continues to be the most important indicator of performance. This will have to be gauged against the Number of Resolved Cases and Time to Resolution to make sure each agent is taking on their fair share of tickets, but encouraging agents to stay focused on quality over quantity is crucial.
Letting them work diligently on a difficult case can really help them grow as well, so as a manager I think it's important to coach them through the hard tickets, not just take them off their plate. If they need help with their numbers for the day, grab a few of their simpler tickets to help get the queue down. Help them feel empowered to research and resolve tough cases on their own, without negative effects to their performance metrics.
--
Vijay Khandekar
Individual agent metrics
1) Average Number of Replies per Request
This metric help us understand the efficiency of our internal process and gives us insights on:
- Understanding the issue correctly
- Assigning it to right person on the first contact
Avg. number of replies per requests = Number of replies on resolved requests / Number of resolved requests
The benchmark for every member of our support team for this metric is 3 and ideal have a lesser score.
2) Customer Satisfaction Level (CSAT)
Customer happiness is the ultimate goal of every support team, and the team at SERPed.net is no different. This is why we track this metric very seriously.
This is how we calculate CSAT score:
% CSAT = [# of positive response / Total response]*100
To ensure that we are on right side of the table, we keep the benchmark as 90% with a lower limit of 85%. We measure it for the individual and overall team both. A CSAT score for an individual below 85% is a red flag and requires attention.
Team level metrics
1) Average First Response Time
It is the most important metric for our team. It also gives our customer an acknowledgement that their issue is being looked into.
We target to keep our ‘Average First Response Time’ below 30 minutes. And, we track the average first-time response for each support agent and for the whole team to track how we are performing.
2) Ticket Resolution Rate
This is another important metric to assess the performance of our ‘Customer Support Team’.
Ticket Resolution Rate = Number of new tickets successfully closed / Total number of tickets
It helps us understand how many issues we are resolving successfully and help us measure the effectiveness of the team.

Tim Chingos
Providing best-in-class technical support is one of the key ways Branch differentiates itself within mobile technology. We track and review support metrics on a bi-weekly basis to ensure we’re meeting the service levels our partners have come to expect.
As a team, we have a 2 hour first response SLA. As users of myriad technology, we know first hand the frustration of sending a support request into what feels like a black hole. Receiving a response within 2 hours allows us to quickly solve our partners’ problems or, at worst, give them an update on timing for our team to provide an in depth solution.
Continued team improvement and growth is key for scalability. We track the number of tickets we receive per new partner who integrates our deep linking technology. We’re keenly aware that our ability to drive help requests per new customer down means we can scale our technical support team with our business. Tracking to this metrics keeps us motivated to improve our technical documentation and GitHub READMEs.
Additionally, we identify ways our Product team can improve onboarding and usability. This fully aligns two teams integrally involved to delivering delightful customer experiences.
Customer satisfaction (CSAT) is our most important metric. CSAT surveys are sent to our partners 2 days after we’ve resolved their help request. We’re nimble enough that we can follow up directly with anyone who’s had a negative experience and take corrective steps, sometimes above and beyond, to rectify the situation. We’ve turned detractors into advocates through this type of outreach.
At Branch, our first core value is “Partners First.” This means that we keep the interests of our partners, customers, and developers top-of-mind. On the Technical Support team, we constantly remind ourselves that we’re helping developers build mobile apps into which they are pouring their heart and soul. This is an honor and a privilege and we take the responsibility seriously.

Taylor Udell
When we use metrics to measure performance, we want to make sure they are reflective of our goal as a solutions team: that the user is happy, and is more likely to be engaged and getting value out of Heap because of their interaction with Heap's solutions team.
We track some traditional metrics such as time to response and time to resolution, but these are used mainly to determine that our processes for responding to customers are efficient and that individuals are all contributing. Metrics such as volume or fastest time to response can be very misleading.
Our main success criteria for both the team and the individual answer the following questions in order to optimize our customers' experiences:
1. How are customers rating their responses?
2. What are the NPS scores of users who have interacted with our solutions team?
3. Are customers who interact with our solutions team more likely to have repeat engagement with the platform?
4. Do answers about specific features result in engagement with the feature, both immediately and over a period of time?
These metrics provide a much more accurate depiction of whether or not our solutions team is successfully conveying the value of Heap to our customers and allows us to focus on the quality of our customers' experiences.

Craig Morrison
When it comes to measuring our customer support, we much prefer to measure, analyse and build strategy from a team level. By design, our customer support and sales members are one in the same, so we need to measure effectiveness both from a revenue perspective and a ‘help’ level.
We’re all about being fast and simple, this makes average hold times and % of calls answered in 30 seconds and one minute for the whole team, a very important metric. Email enquiry response times are equally important and customers certainly appreciate an email response in minutes rather than hours or days.
From a sales perspective, we focus on AOV which is a strong indication of upsells and add-ons across the whole team. This is certainly the key metric we consider when looking at individual team members, which each is compared to the average and what the top team members achieve.
Both sales and ‘help’ performance conversion rates are also measured. We always want to improve our sales conversion rate of inbound leads. Measuring the individual gives us an insight into what is possible and where the best performers knowledge can be shared for the greatest benefit. The conversion rate and speed of resolving enquiries is very important to us to ensure we are upholding our “Fast” brand promise.

Mike Kawula
I’ve had a simple 4-step system I’ve used for growing a new business, that has worked both online and offline for my startups.
Step-3 is creating a “WOW” experience for customers at all times.
This means going above the standard copy/paste canned response, and really connecting with the customer both rapidly and on a personal level.
Assuring we maintained superior levels of support during our rapid growth is something we really focused on here at Social Quant.
We wanted to assure all customers are responded to within hours, 7 days a week and with a personalized response.
In the beginning when we were signing up 50 new customers a month, it was easy. When we shifted to signing up 50+ per day, it got more challenging.
Each customer support team member is reviewed daily by our management, to assure emails were not only responded to within a timely fashion, but random emails are picked and checked to assure a personalized touch was added to the email.
Weekly our teams get together on Zoom, each Monday to kick the new week off and metrics are shared on how the company did as a whole for both response time and quality of the responses. Weeks that are outstanding are celebrated with a virtual pizza party, where each team member receives a little bit extra in their check to have a beverage and pizza on our company.
During our calls, we also ask team members to each share their individual metrics with the team on the call, as they receive them daily via an email from management.
By doing this, each individual team member doesn’t want to disappoint and when they’ve had a bad week, they take ownership and adjust quickly for the team as a whole.

Scot Wingo
1. We survey all customers on their support experience and look at that at the agent and overall level. I've found some folks measure time to respond and length of response - both of those are metrics I don't think 100% correlate to customer satisfaction. e.g. If I hurry to give a short blunt answer, that's not the best thing for the CX. If I wait 3 days and send 30 paragraphs, also not best. customer ratings are the best proxy.
2. At a team level we do look at throughput, backlog, etc., but again I don't think anything is as good as a short customer survey.

Max Al Farakh
In my opinion, customer support metrics of an individual tech and of a whole company are the same. The most important metric and, to be honest, the only one we track seriously in terms of measuring performance is response time. Response time is what really matters to customers if you are doing email or social media support and it should be one of your goals to keep it low. Ideally, less than two hours.
Other metrics, like total resolution time or a number of replies per ticket, are just vanity metrics. Things like these highly depend on the type of support tickets you get -- a ticket can be resolved in five minutes with one reply or it could go on for weeks. I don't think it's a good performance indicator. So, I think that the average response time is the only good metric you can use to measure your team's performance.

Kristian Jonsson
Team Performance
As a SaaS, it’s important to focus on reducing churn. It is six to seven times more expensive to attract a new customer than it is to retain an existing one, so churn rate is one of the key metrics, when we measure our team performance.
Another metric we use to measure our team performance is average handle time. In this case, we track two things: How long does it take between we receive an incoming ticket to we send the first answer, and how long times does it take to solve the ticket?
Each week, we have a short meeting where we discuss the results from the last week, and how we could have done better.
Individual Agent Metrics
Another metric we track is NPS score. When our customers login to their Sleeknote Dashboard, they get the following question:

We track the NPS score as a team performance, but we also does it for each individual agent.
If the answer is 7 or below, we call the customer and ask how we can improve. 14 Days after the call, we send them an email asking the same question. This way we track if the NPS score has improved after the call.
At last, we also send out an email every time we’ve resolved a case, asking how satisfied the customer was with the customer support. This way, we can track how each agent performs.

Rutger Jongepier
1. Individual agent metrics
I think the team results are most important. Of course I keep an eye on individual performance, but I don’t let them compete in any kind of way. My support agents have to preform as a team.
What I do look at on an individual level are things like how many tickets each agent handled in a certain time and when somebody gets a bad rating on a ticket.
2. Team level metrics
On a team level it is the satisfaction rating of the customers that I care about. I also keep an eye on the average first reply time on tickets.
That's A Wrap:
There you have it. The top customer support metrics used by successful support teams to accurately measure performance and improve the customer experience.
Are there are metrics you measure that aren't listed above?
Let us know in the comments below.