Making churn an actionable metric
 by Max Al Farakh ·
Nov 26 2013
by Max Al Farakh ·
Nov 26 2013
By now, everyone probably knows that the churn rate is one of the most important metrics you can track in a SaaS app. It’s a perfectly good metric apart from one thing – it’s not very actionable.
When we talk about, say, “new customers per month”, it’s perfectly clear what we need to do to increase that number: we need to get more people into the funnel or optimize the funnel itself, right? Things are not that obvious when we deal with the churn rate.
Wrong: treating churn as a flat number
We’ve been trying to reduce the churn rate of our SaaS helpdesk app for quite some time now. At the beginning it was huge – about 15%. We were freaking out and tried to fix it with anything we could think of only to find out a month later that we were calculating it wrong. That was our first metrics lesson learned – you have to be 100% sure in your data.
The real churn rate turned out to be around 5% and that was still a pretty big number compared to our friends in the industry:
“The best SaaS sites or applications usually have churn ranging from 1.5% to 3% a month.” – “Lean Analytics”.
We were able to decrease the churn rate to 4%, but again, we were trying anything we could think of. We were not smart about it. We didn’t have a specific task we needed to solve. “Prevent customers from cancelling” is not specific at all.
Right: run cohort analysis to get insight
We were treating churn as a “flat” number: “every month 20 people quit paying for our app”. At this point we needed a deeper understanding to move on. We realized that to understand why customers cancel their subscriptions we need to know when most of them do it.
So I ran a cohort analysis among all customers who cancelled our app and here is what I found:
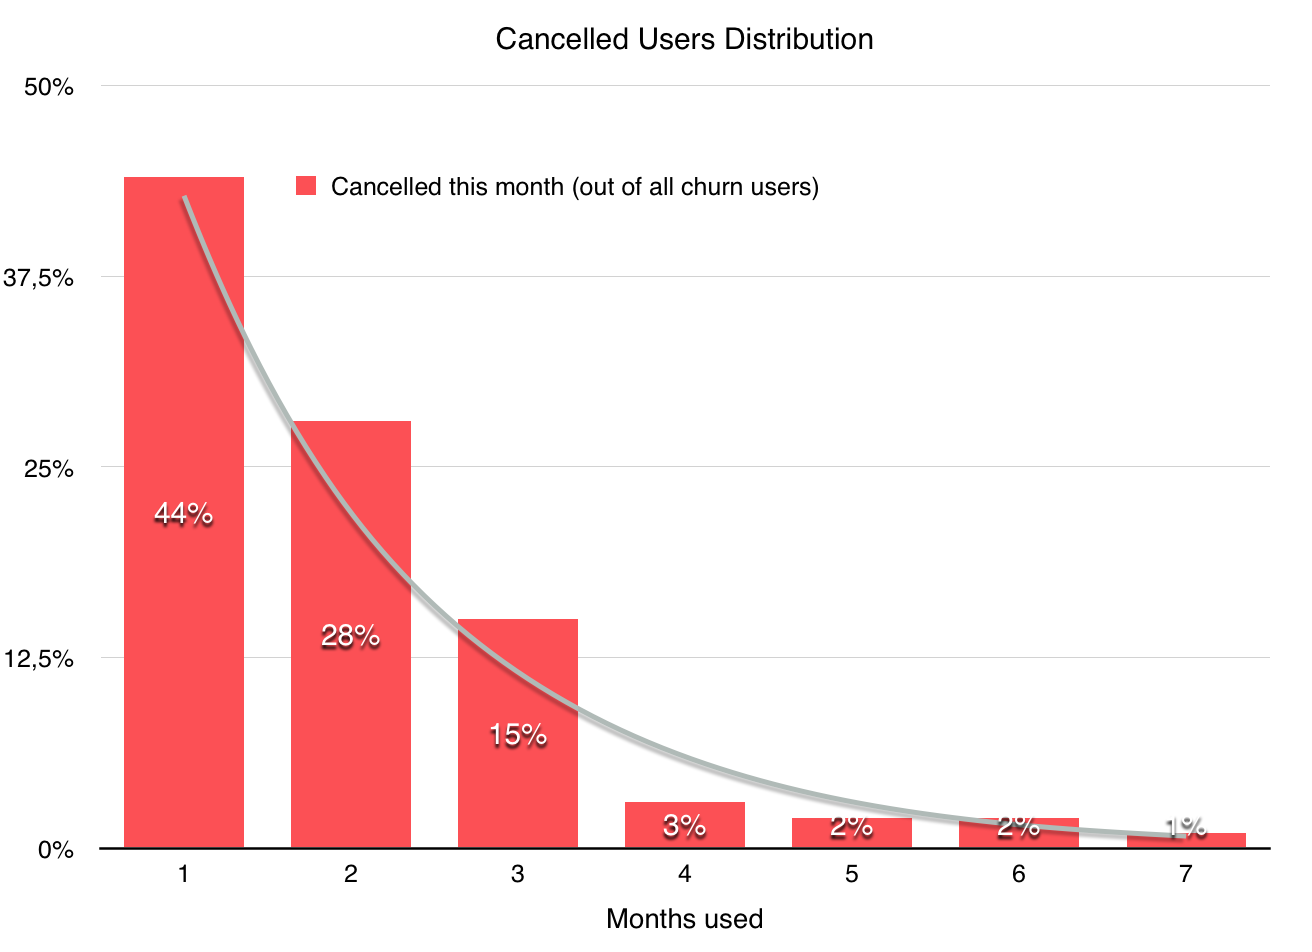
Almost 90% of the churn happens within the first three months of using the software! Essentially this means that if we can make a customer stick with us longer than three months, they will stay. And we will have a 90% improvement on our churn rate – 0.3% per month, which is awesome.
The bottom line
It’s pretty obvious why they don’t quit after the initial three months. We really proud of the work our team has done with Helpdesk and we know for sure that it gets more value over time. We just needed to figure out why customers quit too early. In other words, how can we help them gain more value out of our app faster?
We are trying out a couple of things right now and I’ll publish the results later, if they are useful, but the important thing is now we know exactly what we need to do. We made churn rate an actionable metric – we need to make customers stick with us for the first three months.
So, if you do one thing today – run a cohort analysis of your churn rate.