Average customer support metrics from 1000 companies
 by Max Al Farakh ·
Updated Apr 18 2026
by Max Al Farakh ·
Updated Apr 18 2026
Note: the benchmark numbers in this article come from a 2017 analysis of Jitbit's ~1,000 SaaS customers. The percentile thresholds below are from that original dataset. Based on what we see in the industry today (tighter customer expectations, more live-chat replacing email, and AI-assisted first responses), these thresholds are now on the generous side — in 2026, a "top 5% response time" is closer to 5–10 minutes than the 16 minutes we saw in 2017. Use the numbers below as a historical baseline, and expect your own modern target to be tighter.
That's not the first time we dive into customer service metrics. Almost four years ago I wrote an article about the most important metrics you need to monitor - "4 Metrics to Monitor Customer Happiness". Everything in that article still remains true - the core set of metrics didn't change. Here they are:
- Response time - the time between ticket creation date and the first technician response
- Resolution time - the time between ticket creation and closure dates
- Average number of tickets created per day
- Average number of tickets closed per day
If you need more information on how those metrics are calculated read the article linked above.
The idea for this post came from one of our customers. Each month we send out an email to all customers with a quick rundown of all their metrics. Yesterday we got this reply:
Our average response time was two hours this month. I feel like we did great, but how do we fare against your other customers?
That's a very good question. How useful the metrics are if you don't know what numbers are good or bad? So I decided to launch Excel and crunch some numbers.
Sample data
Our ticketing system is used by roughly a thousand businesses via SaaS (with another 2k using the on-premise version) - from single freelancers to huge enterprises across all industries. We used this data once before - "Lessons learned from analyzing 7 million customer support tickets".
All the numbers in this article are median, not average, for better results.
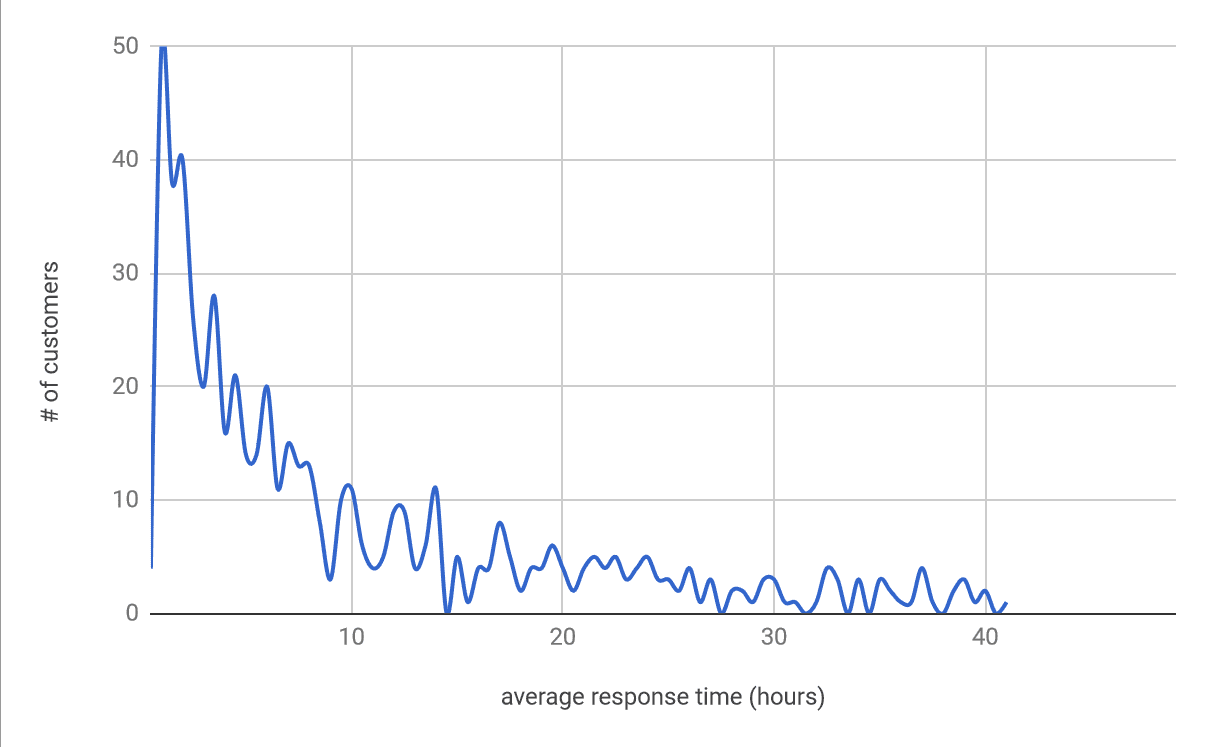
Response time
Response time is probably the most important metric. The good thing about it is that you can actually compare yourself to others. The response time should always be as low as possible despite your company or industry specifics.
So what's a good response time? I always thought that less than two hours is good enough. But let's see how far it is from the truth.
The average response times to customer support tickets tickets is 7 hours 4 minutes Tweet this
Not as bad as I thought. So how do you fare against others? I made a little widget below that will help you calculate your percentile, but here are some numbers first.
Customers with the average response time of two hours - the number I mentioned above - are in the 20th percentile. One hour is just top %15. Want to be in top 5%? Better reply in 16 minutes to all your tickets.
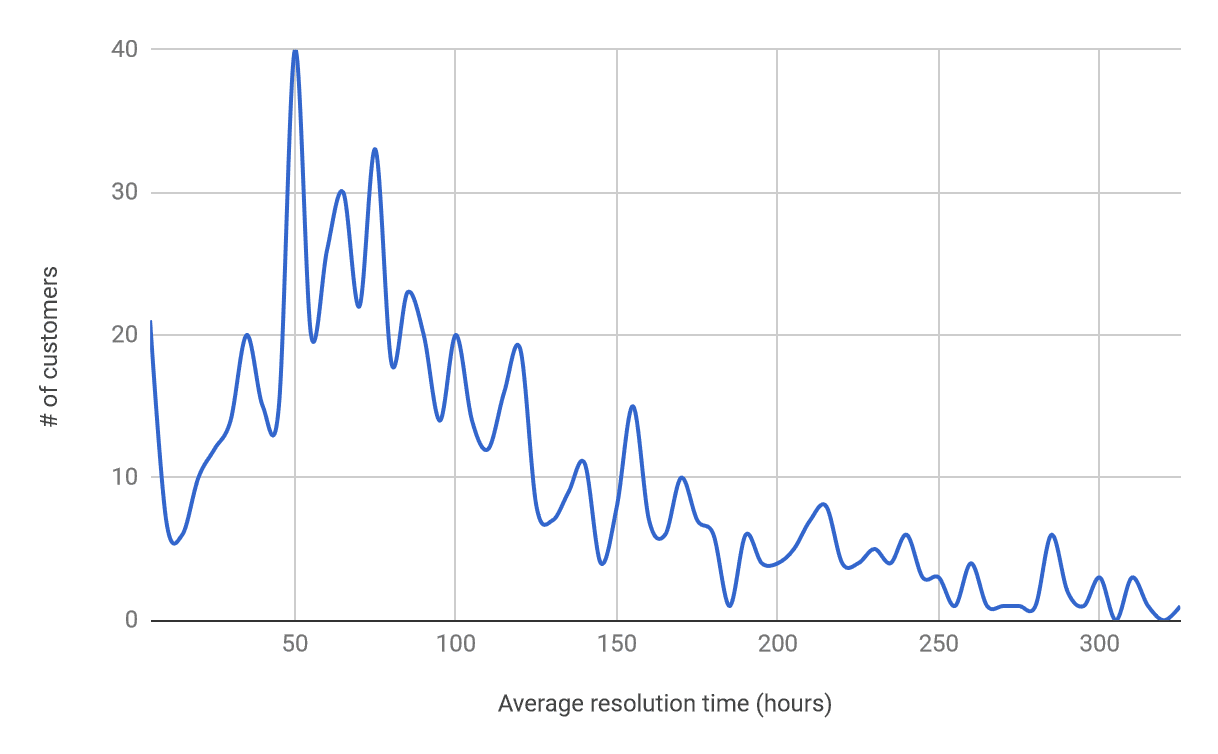
Resolution time
Resolution time may vary across different companies and it's fine - some issues require just one reply while others need months of work. Frankly, it's not as important as the response time, but you should still keep it as low as you can.
Nonetheless, we can use an average number to compare ourselves to.
The average customer support ticket resolution time is 3 days 10 hours (or 82 hours) Tweet this
What about percentiles? Top 5% is 17 hours and top 20% is 43 hours (1 day 19 hours). Calculate yours below.
Average number of tickets created and closed per day
These two metrics are specific to each company depending on its size. I don't think that the average will be useful here, so I had a better idea.
One of the hardest things in customer support is hiring. You should hire new techs in advance, but it is really hard to predict when you need to do that. Wouldn't it be nice to know what number of tickets one tech can handle on average?
I took the average daily number of tickets for a customer and divided it by the number of techs in their team. Then just took an average again.
The average number of support tickets that one technician can handle per day is 21. Tweet this
So probably once you get to around 30 tickets per tech per day you should start thinking about hiring another agent.
It's always nice to have something to measure your team's success against. Now you have some numbers that you can use as a reference. If you want me to calculate some other metrics let me know in the comments.
Have these benchmarks held up? A 2026 view
The core percentile shape of the 2017 data — a long tail where most teams cluster in the 2–8 hour response range and a small minority respond within minutes — is still what we see across our customer base today. What has moved since 2017:
- First-response expectations are tighter. Widely-cited industry surveys from the past few years (HubSpot State of Service, Salesforce State of Service, Zendesk CX Trends) all show that customers now expect first responses in under an hour for email and under a few minutes for live chat. What counted as "top 15%" in 2017 (a one-hour response) is now closer to "table stakes" for B2B SaaS.
- Resolution time is less meaningful as a single number. With more self-service and bot deflection, the tickets that reach a human are, on average, harder. Some teams now track "time to first meaningful response" and "time to resolution after human engagement" separately.
- AI-assisted first replies have compressed the fastest percentiles. Teams with AI assist or agent copilots routinely hit sub-five-minute first responses during business hours — which used to require a dedicated real-time queue.
- Tickets-per-agent-per-day has crept up. The 2017 number of 21 tickets per tech per day assumed mostly manual work. Teams using canned responses, KB suggestions, and AI-assisted drafting now push that considerably higher — although the ceiling is still set by complexity of the issues, not by raw keystrokes saved.
The honest summary: the 2017 percentiles below are a reasonable historical baseline, but if you're setting SLAs today, aim tighter than the "top 20%" column suggests. Your competitors already are.
Frequently asked questions
What is a good customer support response time in 2026?
For email, under one hour during business hours is now a reasonable baseline for any B2B SaaS or commerce business — and under 15 minutes separates the fast-movers. For live chat, customers expect the first message within a minute. For phone, most callers hang up after two to three minutes on hold. These are shorter than the 2017 benchmarks in this article because customer expectations have tightened and competitors offering faster response have reset the bar.
What is a good customer support resolution time?
It depends heavily on the ticket type. Simple "how do I" questions should close in one reply, within the same business day. Bug reports and account issues typically resolve in 1–3 business days. Complex technical tickets or anything needing engineering involvement can legitimately take a week or more. A single "average resolution time" number across all ticket types is misleading — segment by category and measure each separately.
How many support tickets can one agent handle per day?
The 2017 average in this article was 21, and the industry range is typically 15–30 for teams doing mostly email and ticket work. AI assistance, canned responses, and KB deflection can push throughput higher for high-volume simple tickets — but the ceiling is always set by the complexity of the issues, not by how fast an agent can type. A realistic modern target is 25–35 tickets per agent per day, with the caveat that quality (CSAT, first-contact resolution) matters more than raw count.
Which customer support metrics matter most?
Four carry most of the weight: first-response time (how quickly you acknowledge), resolution time (how quickly you finish), CSAT or customer satisfaction score (how the customer felt about the interaction), and first-contact resolution rate (percentage of tickets closed without a handoff or reopen). Ticket volume, backlog size, and SLA compliance are useful operational metrics but downstream of these four.