Help Desk Dashboard - Real-Time Support Metrics
A help desk dashboard gives support managers instant visibility into the metrics that matter most: ticket volume, resolution times, response speed, and agent workload. Jitbit Helpdesk includes a built-in real-time dashboard that refreshes automatically, so you always have an up-to-date snapshot of your team's performance without lifting a finger.
What the Help Desk Dashboard Tracks
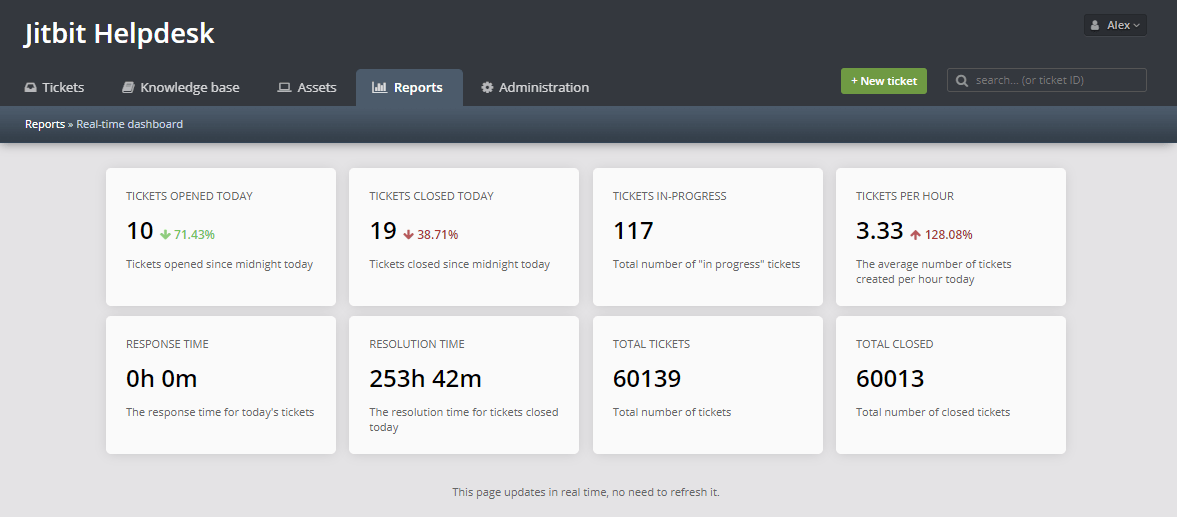
Jitbit's dashboard consolidates all your key support metrics into a single screen. Instead of digging through separate reports, you can see everything at a glance:
- First response time — how quickly agents reply to new tickets
- Average resolution time — how long it takes to close tickets end-to-end
- Incoming ticket volume — the rate new tickets are being created
- Open and in-progress tickets — current backlog at any given moment
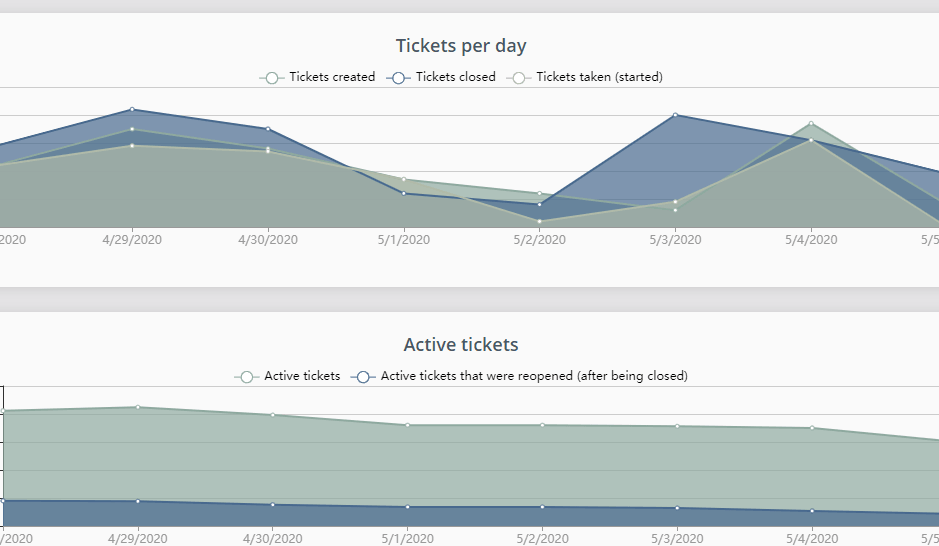
- Tickets per day — daily volume trends over time
- Online agents — how many support agents are currently active
Real-Time Monitoring Without Manual Refreshes
The dashboard updates automatically in real time. There is no need to reload the page or run a new report. This makes it ideal for wall-mounted displays in support centers, NOCs, or office common areas where your team needs a constant pulse on help desk activity.
Many support teams project the dashboard onto a large screen so agents can see queue depth, response speed, and ticket trends throughout the day. When a spike in volume hits, the team spots it immediately rather than discovering it buried in an end-of-day report.
Spot Bottlenecks Before They Escalate
By surfacing response times and resolution speed alongside ticket volume, the dashboard helps managers identify bottlenecks in real time. If average first-response time is climbing, you can reassign tickets or bring more agents online before your SLA commitments are breached.
Combined with Jitbit's automation rules, you get both proactive visibility (from the dashboard) and automated enforcement (from SLA-triggered escalations). The two features work hand-in-hand to keep your support operation running smoothly.
Who Has Access
The help desk dashboard is accessible to administrators and managers. This keeps sensitive performance data visible to the people who need it while maintaining appropriate access controls for agents and end users.
Beyond the Dashboard: Detailed Reporting
The dashboard is designed for at-a-glance monitoring. When you need to dig deeper — compare agent performance over time, analyze ticket distribution by category, or export data to Excel — Jitbit's full reporting suite picks up where the dashboard leaves off. You get summary reports, technician statistics, response speed charts, knowledge base analytics, and a custom report builder for advanced analysis.