Helpdesk Reporting - Built-in Reports and Analytics
You cannot improve what you do not measure. Helpdesk reporting gives support managers the visibility they need to spot bottlenecks, track agent performance, and prove the value of their team. Jitbit Helpdesk ships with a full suite of built-in reports and analytics, so you can start measuring from day one - no third-party BI tools required.
Every report supports filtering by date range, category, tags, and assignee. And every report can be exported to Excel or CSV for deeper analysis. Here is a walkthrough of each reporting feature.
Ticket summary report
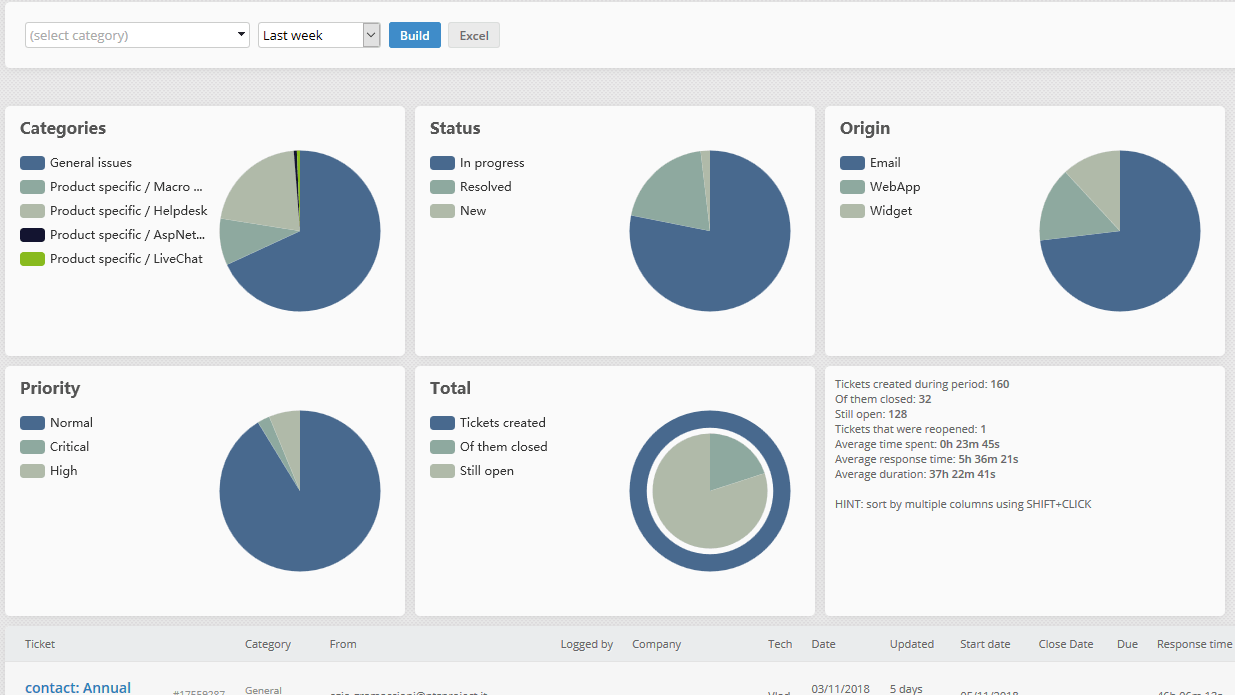
The summary report is your go-to view for a high-level look at helpdesk activity. It displays all tickets in a filterable table with columns for response times, resolution duration, time spent, assignees, and creation dates. A chart at the top gives you a visual overview of ticket volume and trends.
Use it to answer questions like:
- How many tickets did we resolve last month?
- Which categories generate the most volume?
- Where are our longest resolution times?
Need to dig deeper? Export the entire table to Excel with one click and run pivot tables, charts, or share it with stakeholders.
Ticket volume and distribution report
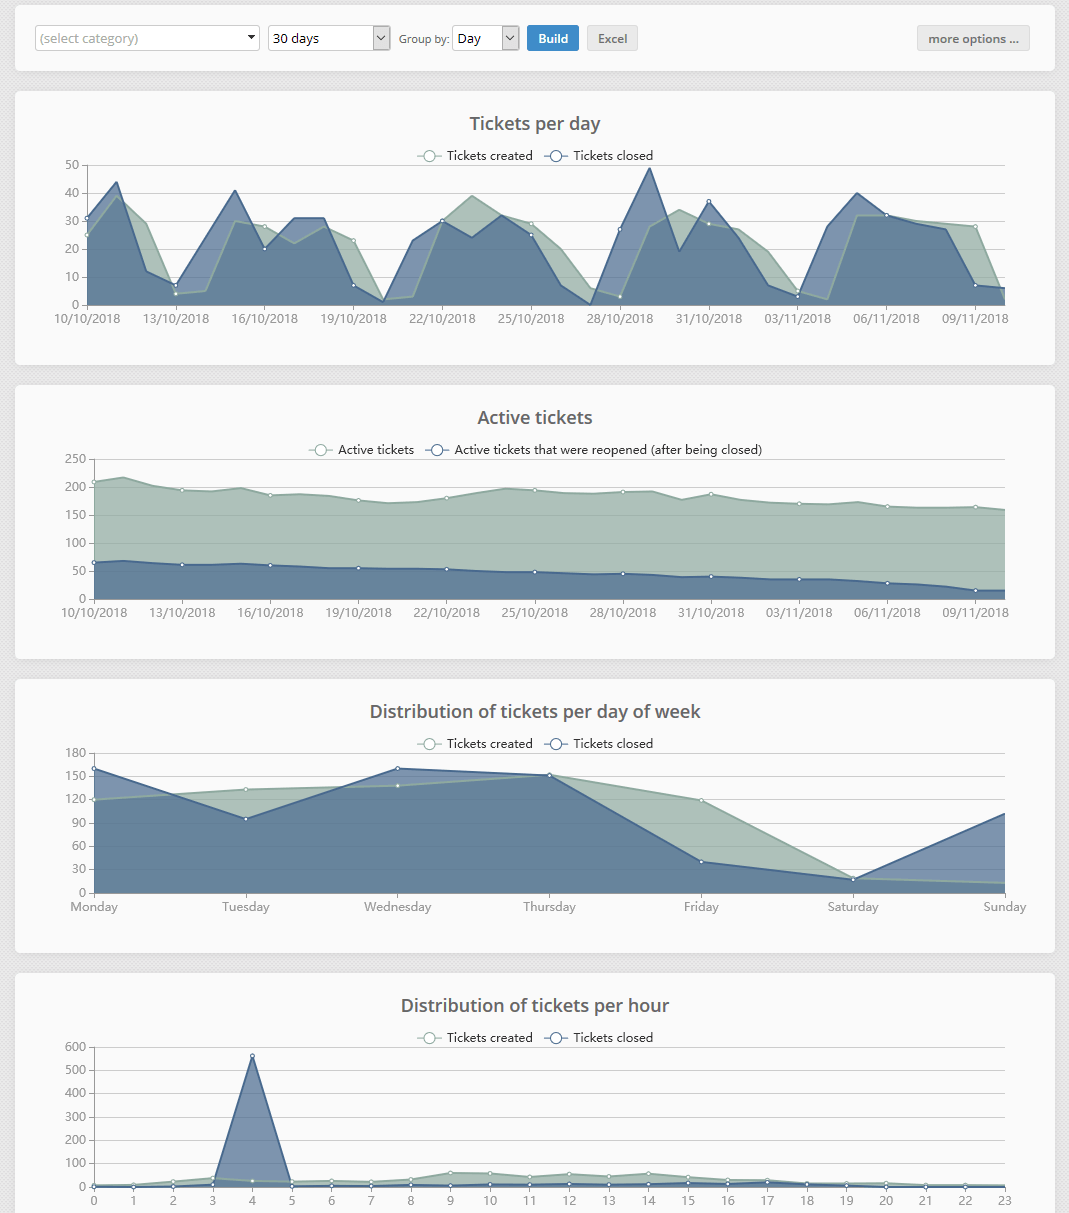
The "Tickets per day" report shows how many tickets were created and closed per day, week, or month. But it goes further than simple counts - it also breaks down ticket distribution by day of week and time of day.
This is invaluable for capacity planning. You will quickly spot patterns like "most tickets arrive on Wednesdays at 3 PM" or "Mondays see twice the volume of Fridays." Armed with that data, you can schedule staff to match demand and avoid SLA breaches during peak hours.
Technician performance statistics
Which agent resolves the most tickets? Who has the fastest first-response time? The technician statistics report answers these questions with hard numbers. Use it to identify top performers, spot agents who may need additional training, or simply pick your "support agent of the month."
When combined with the response speed report below, technician stats give you a complete picture of individual agent productivity and quality.
User and company statistics
These two reports show ticket volume broken down by individual user and by company. You can see how many tickets each customer or company has created, how many remain open, and how their volume trends over time.
This is especially useful for account management. You can quickly identify high-touch clients that may benefit from dedicated support, proactive outreach, or a knowledge base article addressing their most common questions.
Response speed and resolution time report
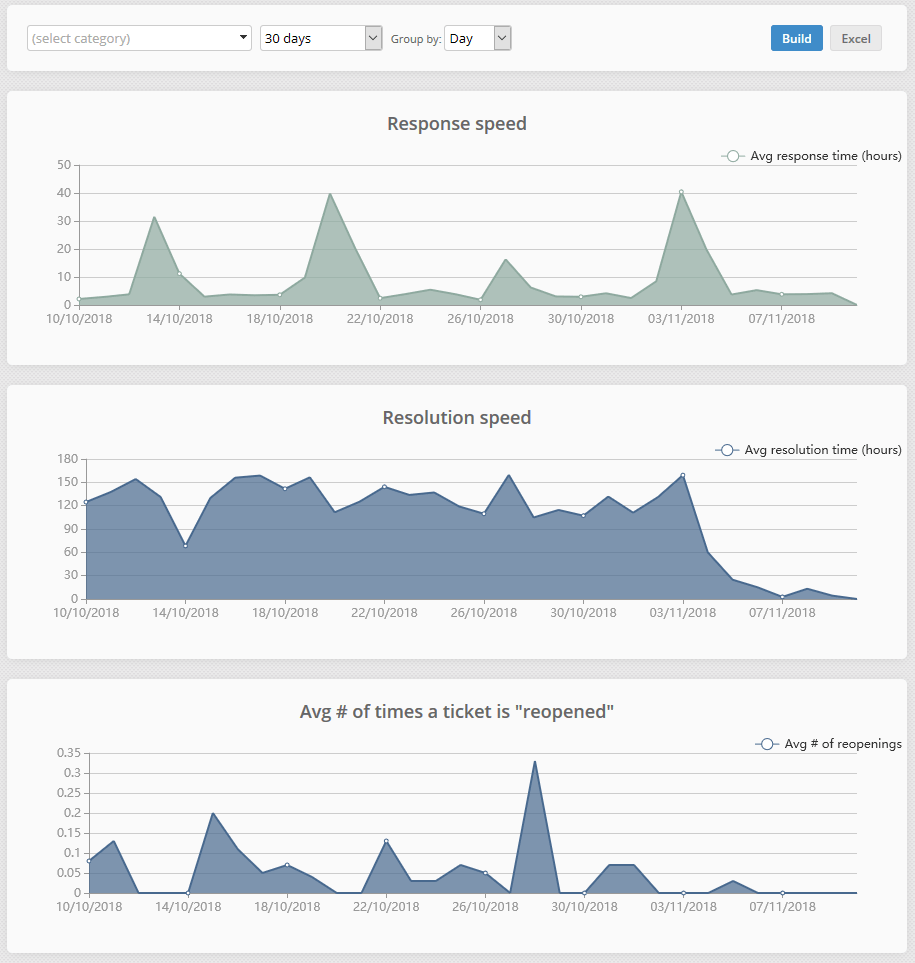
Response speed and resolution time are the two most critical helpdesk metrics. This report tracks both with line charts over any time period you choose.
- First response speed - the time between ticket creation and the first agent reply.
- Resolution time - the total time from ticket creation to closure.
Both metrics are displayed in hours. Use this report to monitor SLA compliance, track improvement trends, and benchmark your team against industry standards. A steady downward trend in both lines means your support operation is getting faster and more efficient.
Knowledge base analytics
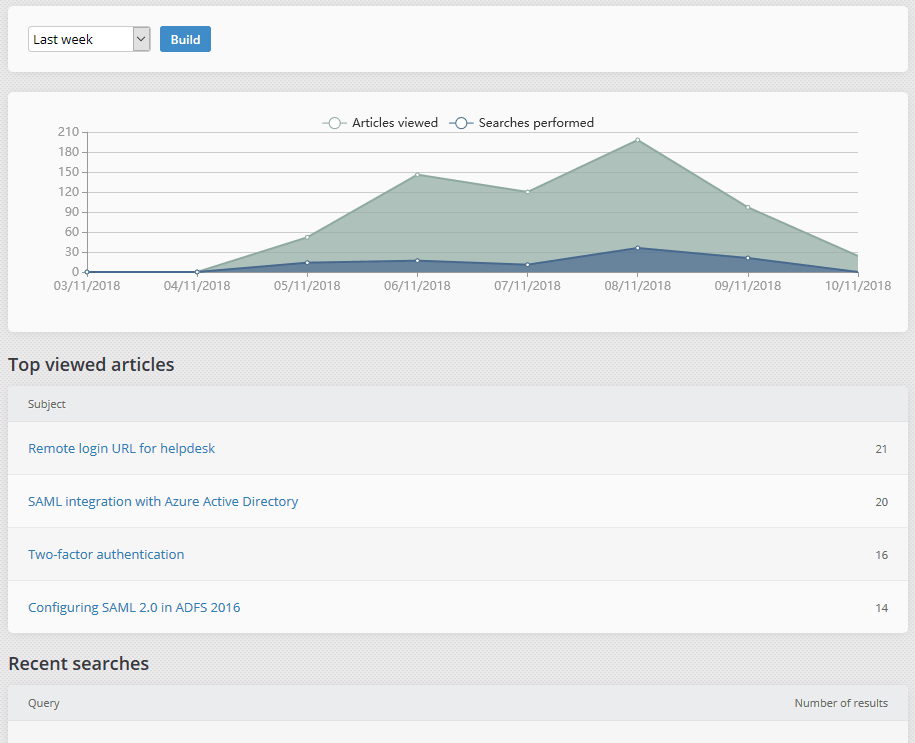
Your knowledge base is only valuable if customers actually use it. The KB report shows your most-viewed articles, the 20 most recent search queries, and whether those searches returned results.
Pay special attention to searches with zero results - they reveal exactly what content you need to create next. Filling those gaps reduces ticket volume and improves customer self-service.
Custom report builder
When built-in reports are not enough, the custom report builder lets you create exactly the report you need. Combine any dimensions and metrics to answer specific business questions:
- Which ticket category has the longest average resolution time?
- Which technician has the fastest first-response speed?
- Which company's tickets consume the most agent time?
- How does ticket volume by priority change month over month?
Custom reports can be exported to Excel and CSV, just like every other report in the system.
Real-time dashboard
In addition to historical reports, Jitbit Helpdesk includes a real-time dashboard that shows live metrics - tickets in progress, agents online, average response speed, and more. It auto-refreshes, so you can display it on a wall-mounted screen in your support center for at-a-glance monitoring.
Together, the reporting suite and the live dashboard give you both the historical depth and real-time visibility you need to run a data-driven support operation.